Please refer to important disclosures at the end of this report
1
(` cr)
3QFY20
3QFY19
% yoy
2QFY20
% qoq
Revenue
193
175
10.6
193
0.4
EBITDA
31
20
58.8
36
(12.0)
OPM (%)
16.3
11.3
494bp 18.6
(229bp)
Reported PAT
22
12
80.5
27
(16.6)
Source: Company, Angel Research
For 3QFY2020, Hawkins Cookers Ltd (HCL) posted strong set of numbers, exceeding
our expectations on top-line and bottom-line fronts
. Revenue grew by ~11% yoy.
The company’s operating margins improved by 494bps yoy. On the bottom-
line
front, HCL reported growth of ~80% yoy to `
22cr on the back of healthy revenue
growth and operating performance.
Top-line grew ~11% yoy: HCL’s top-line grew by ~11% yoy to `
193cr on the back
of healthy growth in cooker and cookware segment. HCL reported healthy g
rowth
compared
to its leader in market, which signified the market share gain during the
quarter. During the quarter, the company launched two products viz.
two dish and
three dish set pressure cookers.
Strong operating performance aided profitability: On
the operating front, the
company reported better margins, up 494bps yoy on the
back of lower raw material
price and other expenditure. On the bottom-
line front, HCL reported growth of
~80% yoy to `22cr on the back of strong operating performance and healthy top
-
line growth.
Outlook and Valuation: We forecast HCL to report healthy top-
line CAGR of ~13%
to `954cr over FY2019-
22E on the back of government initiatives, new product
launches, strong brand name and wide distribution network. On the bottom-
line
front (reported PAT), we estimate ~24% CAGR to `
102cr due to strong revenue and
operating margin improvement (on the back of correction in raw material prices).
Thus, we maintain BUY on the stock with a revised Target Price of `5,232.
Key Financials
Y/E March (` cr)
FY2019 FY2020E FY2021E
FY2022E
Net sales 653 734 837 954
% chg 18.1 12.5 14.0 14.0
Adj. Net profit 54 78 89 102
% chg 11.4 43.9 14.5 14.7
EBITDA margin (%) 13.2 15.0 15.1 15.1
EPS (`) 102.5 147.4 168.9 193.8
P/E (x) 43.8 30.4 26.6 23.2
P/BV (x) 20.0 15.4 12.4 9.9
RoE (%) 45.7 50.6 46.8 42.7
RoCE (%) 55.0 57.0 54.5 50.6
EV/Sales (x) 3.6 3.2 2.8 2.5
EV/EBITDA (x) 27.5 21.5 18.6 16.2
Source: Company, Angel Research
BUY
CMP `4,489
Target Price `5,232
Investment Period 12 months
Stock Info
Sector Houseware
Market Cap (` cr) 2,373
Net Debt (` cr)
(7)
Beta 0.5
52 Week High / Low 4,650/2,606
Avg. Daily Volume 2,944
Face Value (`) 10
BSE Sensex 39,872
Nifty 11,707
Reuters Code HWKN.BO
Bloomberg Code HAWK.IN
Shareholding Pattern (%)
Promoters
56.0
MF / Banks / Indian
15.3
FII / NRIs / OCBs
1.5
Indian Public/Others
27.2
Abs.(%) 3m 1yr 3yr
Sensex
(1.1)
9.0 41.2
HCL 16.2 46.2 49.3
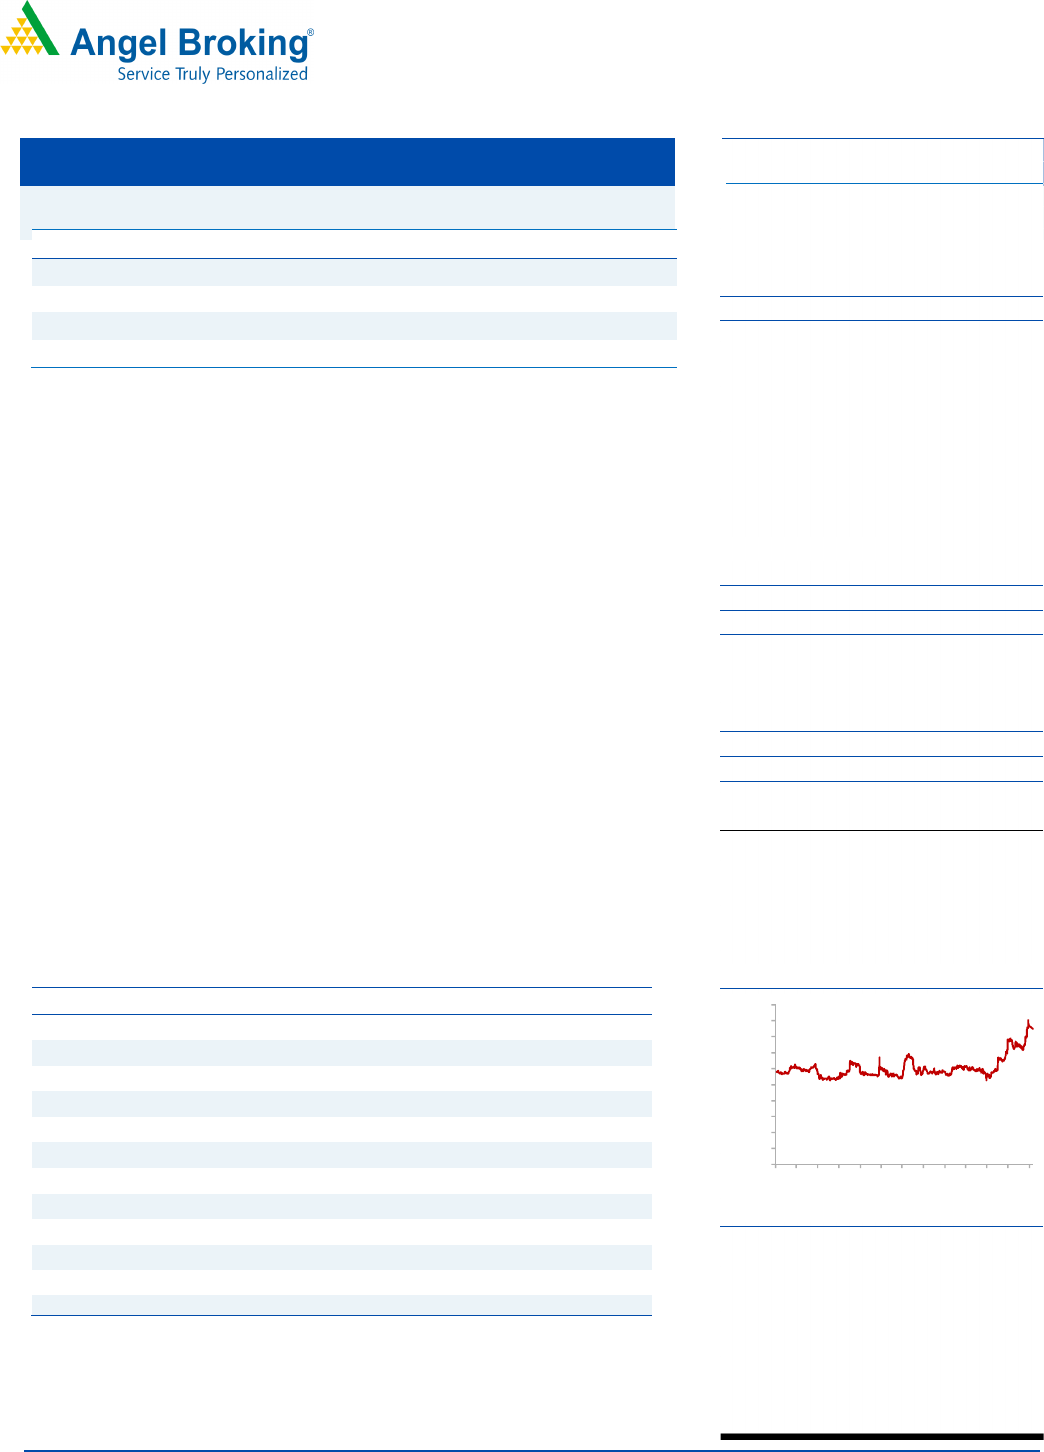
Historical share price chart
Source: Company, Angel Research
Amarjeet S Maurya
022-40003600 Ext: 6831
amarjeet.maurya@angelbroking.com
Hawkins Cookers Ltd
Performance Update
0
500
1000
1500
2000
2500
3000
3500
4000
4500
5000
Jan-17
Apr-17
Jul-17
Oct-17
Jan-18
Apr-18
Jul-18
Oct-18
Jan-19
Apr-19
Jul-19
Oct-19
Jan-20
3QFY2020 Result Update | Houseware
February 4, 2020
Hawkins Cooker | 3QFY2020 Result Update
February 4, 2020
2
3QFY2020 Performance
Y/E March (` cr)
3QFY20
3QFY19
% yoy
2QFY20 % qoq
9MF20
9MF19
% chg
Net Sales
193
175
10.6
193
0.4
528
468
12.8
Consumption of RM
79
77
2.7
88 (10.3)
232
206
12.6
(% of Sales)
41.1
44.2
45.9
44.0
44.1
Staff Costs
25
23
5.7
25
(1.3)
71
67
5.6
(% of Sales)
12.7
13.3
12.9
13.5
14.4
Other Expenses
58
54
6.4
43
33.2
135
130
3.7
(% of Sales)
29.9
31.1
22.6
25.6
27.8
Total Expenditure
162
155
4.5
157
3.2
439
404
8.6
Operating Profit
31
20
58.8
36
(12.0)
89
64
39.2
OPM
16.3
11.3
18.6
16.9
13.7
Interest
1
1
(1.1)
1
(22.4)
3
3
6.0
Depreciation
1
1
16.7
1
6.2
3
3
14.5
Other Income
1
1
(7.0)
1
27.4
2
3
(30.7)
PBT (excl. Ext Items)
30
19
60.5
34
(11.4)
85
62
37.9
Ext (Income)/Expense
-
-
-
-
-
PBT (incl. Ext Items)
30
19
60.5
34
(11.4)
85
62
37.9
(% of Sales)
15.7
10.8
17.8
16.2
13.2
Provision for Taxation
8
6
21.6
7
7.9
22
21
5.2
(% of PBT)
25.8
34.0
21.2
26.1
34.2
Reported PAT
22
12
80.5
27
(16.6)
63
41
54.9
PATM
11.6
7.1
14.0
12.0
8.7
Source: Company, Angel Research

Hawkins Cooker | 3QFY2020 Result Update
February 4, 2020
3
Outlook and Valuation
We forecast HCL to report healthy top-line CAGR of ~13% to `954cr over FY2019-
22E on the back of government initiatives, new product launches, strong brand
name and wide distribution network. On the bottom-line front (reported PAT), we
estimate ~24% CAGR to `102cr due to strong revenue and operating margin
improvement (on the back of correction in raw material prices). Thus, we maintain
BUY on the stock with a revised Target Price of `5,232.
Downside risks to our estimates
Volatile aluminium prices: Aluminium accounts for ~20% of net sales of HCL.
Volatility in aluminium prices will have a negative impact on the company’s
performance.
Economic slowdown: Economic slowdown will affect the performance of the
company.
Competition: Losing market share due to stiff competition could impact the
profitability of company.
Company Background
Hawkins Cookers Ltd (HCL) was incorporated in 1959 by Mr. HD Vasudeva. HCL
operates in two segments i.e. Pressure Cookers and Cookware. The pressure
cookers are marketed under the flagship brand Hawkins and also under Futura and
Miss Mary; cookware is sold under the Futura brand name. The company has
approximately 75 models of pressure cookers in eleven different varieties. Currently,
the domestic market contributes around 94% of the overall sales and rest comes
from

Hawkins Cooker | 3QFY2020 Result Update
February 4, 2020
4
Profit & Loss Statement
Y/E March (` cr) FY2018
FY2019
FY2020E
FY2021E
FY2022E
Net Sales 553
653
734
837
954
% chg 7.9
18.1
12.5
14.0
14.0
Total Expenditure 482
567
624
711
810
Raw Material 261
293
323
368
420
Personnel 76
91
103
118
136
Others Expenses 145
182
198
224
255
EBITDA 71
86
110
126
144
% chg (5.0)
22.2
27.8
14.8
14.0
(% of Net Sales) 12.8
13.2
15.0
15.1
15.1
Depreciation& Amortisation 4
4
5
6
7
EBIT 67
82
105
121
137
% chg (5.5)
22.9
28.4
14.4
13.8
(% of Net Sales) 12.1
12.6
14.4
14.4
14.4
Interest & other Charges 4
4
4
4
4
Other Income 11
4
3
3
4
(% of PBT) 15.0 5.0
2.9
2.5 2.9
Recurring PBT 74
82
104
119
137
% chg 4.0
11.6
26.6
14.5
14.7
Tax 25
28
26
30
34
(% of PBT) 34.0
34.2
25.2
25.2
25.2
PAT (reported) 49
54
78
89
102
Extraordinary Items -
-
-
-
-
ADJ. PAT 49
54
78
89
102
% chg 2.7
11.4
43.9
14.5
14.7
(% of Net Sales) 8.8 8.3
10.6
10.7
10.7
Basic EPS (`) 92.0
102.5
147.4
168.9
193.8
Fully Diluted EPS (`) 92.0
102.5
147.4
168.9
193.8
% chg 2.7
11.4
43.9
14.5
14.7

Hawkins Cooker | 3QFY2020 Result Update
February 4, 2020
5
Balance Sheet
Y/E March (` cr) FY2018
FY2019
FY2020E
FY2021E
FY2022E
SOURCES OF FUNDS
Equity Share Capital 5
5
5
5 5
Reserves& Surplus
105
113
149
185
235
Shareholders Funds
110
119
154
191
240
Total Loans 25
31
31
31
31
Deferred Tax Liability 3
2
2
2 2
Total Liabilities
138
152
188
224
274
APPLICATION OF FUNDS
Gross Block 30
37
47
57
67
Less: Acc. Depreciation 7
11
15
21
28
Net Block 23
27
32
36
39
Capital Work-in-Progress
1
2
2
2 2
Investments
-
-
-
-
-
Current Assets
220
237
279
328
394
Inventories 67
100
117
135
157
Sundry Debtors 47
79
93
108
126
Cash 87
35
42
48
64
Loans & Advances 14
19
22
29
38
Other Assets 4
5
6
8
10
Current liabilities
111
118
129
146
166
Net Current Assets
109
119
150
182
229
Deferred Tax Asset 4
4
4
4 4
Mis. Exp. not written off
-
-
-
-
-
Total Assets
138
152
188
224
274

Hawkins Cooker | 3QFY2020 Result Update
February 4, 2020
6
Cash flow Statement
Y/E March (` cr)
FY2018
FY2019
FY2020E
FY2021E
FY2022E
Profit before tax
74
82
104
119
137
Depreciation
4
4
5
6
7
Change in Working Capital
22
(62)
(24)
(26)
(31)
Interest / Dividend (Net)
(2)
0
4
4
4
Direct taxes paid
(22)
(28)
(26)
(30)
(34)
Others
(5)
(2)
0
0
0
Cash Flow from Operations
69
(6)
63
74
83
(Inc.)/ Dec. in Fixed Assets
(1)
(8)
(10)
(10)
(10)
(Inc.)/ Dec. in Investments
(12)
50
0
0
0
Cash Flow from Investing
(13)
42
(10)
(10)
(10)
Issue of Equity
0
0
0
0
0
Inc./(Dec.) in loans
7
6
0
0
0
Dividend Paid (Incl. Tax)
(44)
(45)
(42)
(53)
(53)
Interest / Dividend (Net)
3
(49)
(4)
(4)
(4)
Cash Flow from Financing
(35)
(87)
(47)
(57)
(57)
Inc./(Dec.) in Cash
22
(52)
7
6
16
Opening Cash balances
65
87
35
42
48
Closing Cash balances
87
35
42
48
64

Hawkins Cooker | 3QFY2020 Result Update
February 4, 2020
7
Key Ratios
Y/E March
FY2018
FY2019 FY2020E
FY2021E
FY2022E
Valuation Ratio (x)
P/E (on FDEPS)
48.8
43.8 30.4
26.6
23.2
P/CEPS
45.4
40.8 28.7
25.0
21.7
P/BV
21.6
20.0 15.4
12.4
9.9
Dividend yield (%) 1.6 1.6 1.8
2.2
2.2
EV/Sales 4.2 3.6 3.2
2.8
2.5
EV/EBITDA
32.8
27.5 21.5
18.6
16.2
EV / Total Assets
16.8
15.6 12.6
10.5
8.6
Per Share Data (Rs)
EPS (Basic)
92.0
102.5
147.4
168.9
193.8
EPS (fully diluted)
92.0
102.5
147.4
168.9
193.8
Cash EPS
98.9
110.1
156.3
179.8
206.8
DPS
70.0
70.0 80.0
100.0
100.0
Book Value
207.6
224.2
291.7
360.5
454.3
Returns (%)
ROCE
49.6
55.0 57.0
54.5
50.6
Angel ROIC (Pre-tax)
139.9
72.0 73.7
69.7
66.3
ROE
44.3
45.7 50.6
46.8
42.7
Turnover ratios (x)
Asset Turnover (Gross Block)
18.3
17.5 15.6
14.6
14.2
Inventory / Sales (days)
44
56
58
59
60
Receivables (days)
31
44
46
47
48
Payables (days)
34
30
30
30
30
Working capital cycle (ex-cash) (days)
41
70
74
76
78

Hawkins Cooker | 3QFY2020 Result Update
February 4, 2020
8
Research Team Tel: 022
-
39357800 E
-
mail:
research@angelbroking.com Website: www.angelbroking.com
DISCLAIMER
Angel Broking Limited (hereinafter referred to as “Angel”) is a registered Member of National Stock Exchange of India Limited, Bombay
Stock Exchange Limited and Metropolitan Stock Exchange Limited. It is also registered as a Depository Participant with CDSL and Portfolio
Manager and Investment Adviser with SEBI. It also has registration with AMFI as a Mutual Fund Distributor. Angel Broking Limited is a
registered entity with SEBI for Research Analyst in terms of SEBI (Research Analyst) Regulations, 2014 vide registration number
INH000000164. Angel or its associates has not been debarred/ suspended by SEBI or any other regulatory authority for accessing
/dealing in securities Market. Angel or its associates/analyst has not received any compensation / managed or co-managed public
offering of securities of the company covered by Analyst during the past twelve months.
This document is solely for the personal information of the recipient, and must not be singularly used as the basis of any investment
decision. Nothing in this document should be construed as investment or financial advice. Each recipient of this document should make
such investigations as they deem necessary to arrive at an independent evaluation of an investment in the securities of the companies
referred to in this document (including the merits and risks involved), and should consult their own advisors to determine the merits and
risks of such an investment.
Reports based on technical and derivative analysis center on studying charts of a stock's price movement, outstanding positions and
trading volume, as opposed to focusing on a company's fundamentals and, as such, may not match with a report on a company's
fundamentals. Investors are advised to refer the Fundamental and Technical Research Reports available on our website to evaluate the
contrary view, if any
The information in this document has been printed on the basis of publicly available information, internal data and other reliable sources
believed to be true, but we do not represent that it is accurate or complete and it should not be relied on as such, as this document is for
general guidance only. Angel Broking Limited or any of its affiliates/ group companies shall not be in any way responsible for any loss
or damage that may arise to any person from any inadvertent error in the information contained in this report. Angel Broking Limited
has not independently verified all the information contained within this document. Accordingly, we cannot testify, nor make any
representation or warranty, express or implied, to the accuracy, contents or data contained within this document. While Angel Broking
Limited endeavors to update on a reasonable basis the information discussed in this material, there may be regulatory, compliance, or
other reasons that prevent us from doing so.
This document is being supplied to you solely for your information, and its contents, information or data may not be reproduced,
redistributed or passed on, directly or indirectly.
Neither Angel Broking Limited, nor its directors, employees or affiliates shall be liable for any loss or damage that may arise from or in
connection with the use of this information.
Ratings (Returns):
Buy (> 15%)
Accumulate (5% to 15%)
Neutral (
-
5 to 5%)
Reduce (-5% to -15%) Sell (< -15%)
Disclosure of Interest Statement
Hawkins Cookers
1. Financial interest of research analyst or Angel or his Associate or his relative No
2. Ownership of 1% or more of the stock by research analyst or Angel or associates or relatives No
3. Served as an officer, director or employee of the company covered under Research No
4. Broking relationship with company covered under Research No